EHR data visualization is transforming how behavioral health providers track treatment outcomes.
By turning complex data into clear, actionable insights, clinicians can monitor progress, identify risks early, and adjust care effectively. This approach not only improves patient outcomes but also meets insurer and regulatory demands for measurable results.
Key benefits of EHR data visualization include:
Real-time dashboards: Track patient progress, spot trends, and reduce manual data entry.
Standardized tools: Use assessments like PHQ-9 and GAD-7 for depression and anxiety tracking.
AI integration: Automate documentation and identify risks with predictive analytics.
Patient engagement: Simplify updates for patients to track their own progress.
Compliance support: Meet accreditation standards effortlessly.
The right EHR platform, like Opus Behavioral Health EHR, combines automation, customizable tools, and user-friendly dashboards to streamline workflows and improve care delivery. Whether you're a clinician or administrator, these tools save time, reduce errors, and ensure treatment goals are met.
What Makes an Effective EHR Outcomes Dashboard
Core Dashboard Features for Behavioral Health Providers
An outcomes dashboard should do more than just display data - it needs to turn raw numbers into meaningful insights.
The most effective dashboards give clinicians real-time access to patient progress, helping them identify trends and step in before minor concerns escalate into major crises [4][6].
Automation plays a key role here. By automating data collection and offering customizable assessment tools, dashboards can cater to the unique needs of diverse patient populations.
Manual data entry, especially in group therapy settings, can slow things down and lead to errors.
As Judd Carey points out, automated systems reduce these errors and streamline group session tracking [3]. This automation also ensures that patient information flows effortlessly into the system, eliminating the need for staff to juggle between multiple screens or platforms.
The best dashboards also include a broad range of evidence-based measurement tools, such as the PHQ-9 for depression, GAD-7 for anxiety, PCL for PTSD, and WHODAS 2.0 for daily functioning [5][6]. Providers can tailor these tools to their specific focus areas.
For instance, practices treating opioid dependency might track withdrawal symptoms using the COWS scale, while those managing early psychosis might rely on PRIME [5].
Patient portals take dashboards beyond the clinic walls.
Through secure links, patients can share real-time updates on their moods, behaviors, and overall satisfaction from the comfort of their homes.
This remote feedback provides a fuller picture of what’s happening between sessions, often highlighting issues that patients might not bring up during in-person visits [2][6].
"The customizable assessment tools have revolutionized how we track patient progress. We can now visualize treatment outcomes in ways that were impossible with our previous system." - Mark Thompson, Clinical Director at Family Medicine Group [4]
How Opus EHR Simplifies Data Collection
Opus Behavioral Health EHR takes data collection and management to the next level by consolidating everything into a single, easy-to-navigate dashboard.
Instead of toggling between separate systems for lab results, prescriptions, and clinical notes, providers can access all this information in one place [3][9].
This includes two-way lab connectivity, which automates the exchange of test orders and results. For example, if a clinician reviews an inconclusive lab result, they can immediately request follow-up testing without leaving the system [9].
Opus offers over 100 customizable assessment tools, paired with AI-powered documentation support that can cut charting time by as much as 40%. This means providers can spend more time focusing on their patients rather than their paperwork [4].
"Since implementing Opus EHR, our providers spend 35% less time on documentation while capturing more comprehensive clinical data. The AI documentation assistant feels like having an extra team member in every patient encounter." - Dr. Jennifer Williams, Mental Health Practice Owner [4]
Beyond clinical care, Opus supports administrative efficiency with more than 140 practice management reports.
These reports help track key performance metrics like Average Length of Stay and 7/30-day follow-up rates, which are critical for pay-for-performance reimbursement models [3]. Additionally, the system ensures compliance with JCAHO standards, keeping facilities audit-ready while maintaining a strong focus on patient outcomes [2].
With these features, Opus not only simplifies data collection but also provides the tools needed to visualize and interpret key outcome metrics effectively.
Harnessing electronic health record data
Selecting the Right Visualization Methods for Your Metrics
Matching EHR Outcome Metrics to Optimal Chart Visualization Types
Matching Chart Types to Different Outcome Metrics
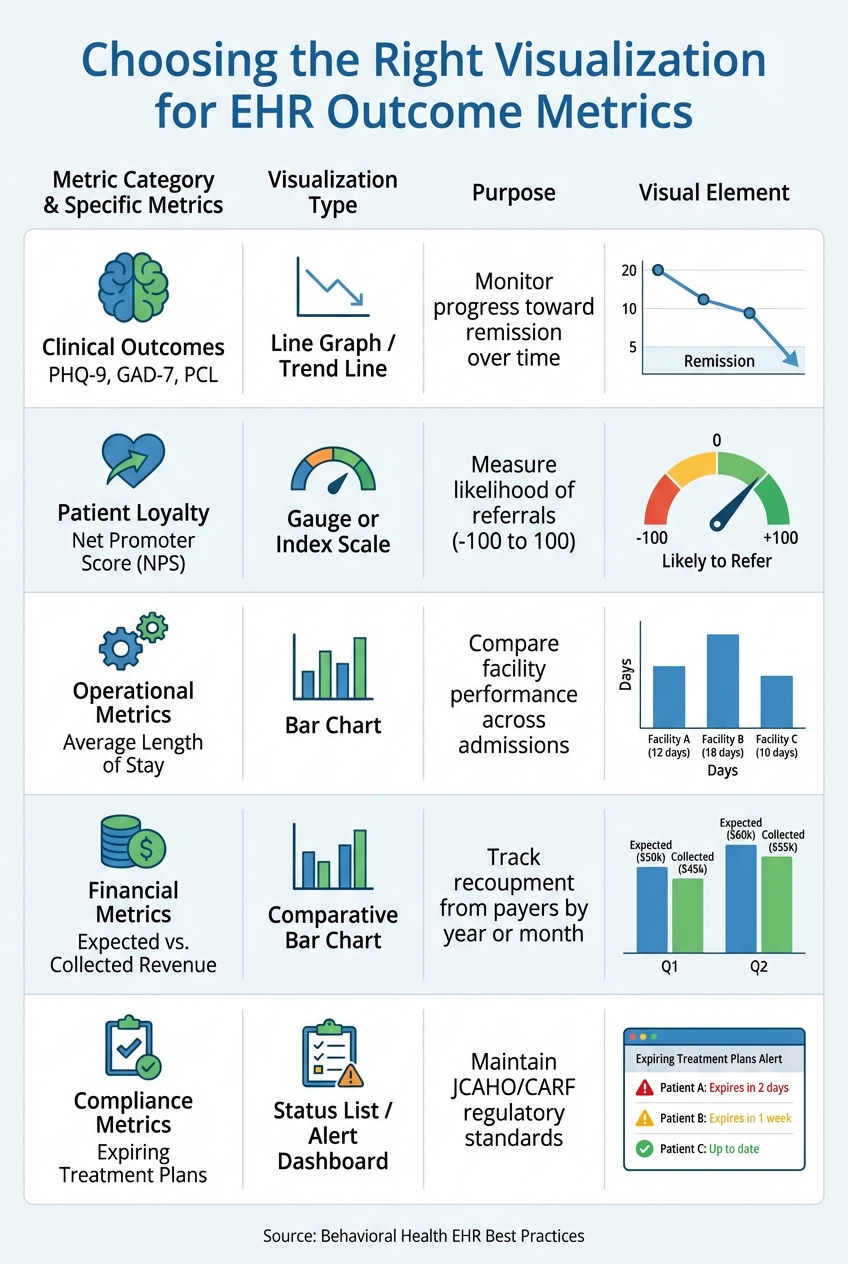
Picking the right chart type is crucial for presenting your data effectively. For instance, line graphs are ideal for tracking clinical progress over time.
This is especially true when using a treatment-to-target approach. If you're monitoring a patient's depression with the PHQ-9 or anxiety using the GAD-7, line graphs make it easy to see trends - whether scores are moving toward remission or signaling the need to adjust the care plan [1][5].
Bar charts are great for side-by-side comparisons. At the enterprise level, they can illustrate operational health, such as comparing a facility's Average Length of Stay across different admission periods or tracking expected versus collected revenue by month [8].
For compliance metrics, dashboards or gauge-style visualizations simplify complex data. Sigmund Software explains it well:
"Think of dashboards as the equivalent of the gas gauge in your car... it provides a simple status report of how much farther your car can travel based on the current performance of those processes" [8].
Here’s a quick breakdown of metrics, their ideal visualizations, and their purposes:
|
Metric Category |
Metric |
Visualization |
Purpose |
|---|---|---|---|
|
Clinical Outcomes |
PHQ-9, GAD-7, PCL |
Line Graph / Trend Line |
|
|
Patient Loyalty |
Net Promoter Score (NPS) |
Gauge or Index Scale |
Measure likelihood of referrals (-100 to 100) [5] |
|
Operational |
Average Length of Stay |
Bar Chart |
Compare facility performance across admissions [5] |
|
Financial |
Expected vs. Collected Revenue |
Comparative Bar Chart |
Track recoupment from payers by year or month [8] |
|
Compliance |
Expiring Treatment Plans |
Status List / Alert Dashboard |
Choosing the right visualization is only part of the equation. Customizing dashboards for specific audiences can significantly improve clarity and engagement.
Creating Visualizations for Clinicians vs. Patients
Dashboards should cater to the unique needs of clinicians and patients. Clinicians benefit from detailed, real-time dashboards that highlight any outliers, such as a sudden spike in PHQ-9 scores, enabling swift intervention [10][12].
These dashboards can also flag results outside expected ranges or alert clinicians to potential crises, reducing their cognitive load and supporting clinical decision-making [11][8].
For patients, simplicity is key. Progress charts should focus on clear, easy-to-understand updates about mood, behavior changes, and progress toward treatment goals [10][2].
When patients can visually track their improvement through straightforward graphics, they’re more likely to stay engaged in their treatment. This dual approach - detailed for clinicians and simplified for patients - helps build a shared understanding, strengthening the therapeutic alliance.
Using Predictive Analytics to Improve Outcome Measurement
How Predictive Analytics Spots Behavioral Health Risks
Predictive analytics examines historical data - like medication adherence, social support, and stress levels - to identify and prioritize patients who may be at high risk of health crises before emergencies occur [13]. This proactive approach enables timely treatment adjustments, helping to prevent complications.
By categorizing patients into different risk levels, predictive analytics allows care managers to focus their attention where it’s needed most. For instance, patients with multiple chronic conditions are flagged for intensive intervention [15]. This is particularly important considering that nearly 20% of adult patients in the U.S. experience hospital readmissions, which collectively cost the healthcare system about $52.4 billion annually [15].
Real-world examples highlight just how effective this approach can be. Take Umpqua Health, a coordinated care organization serving 35,000 Medicaid members in Oregon.
Using the Arcadia platform, they analyzed social determinants of health, past events, and claims data to predict who was at high risk for respiratory complications during wildfire season. This insight allowed them to take preventive action, such as distributing air purifiers through text notifications and community health workers, ultimately avoiding costly health emergencies [15].
Another example is Mend's AI algorithm, which achieved 99% accuracy in predicting missed appointments. This tool helped reduce no-show rates from 40% to single digits [14], ensuring patients stayed on track with their care plans. Additionally, modern EHR platforms now integrate AI tools to streamline clinical documentation and enhance risk detection, building on these successes.
AI-Powered Features in EHR Platforms
After identifying risks through predictive analytics, AI-powered features in EHR platforms take it a step further by improving clinical workflows. These tools automate documentation processes and extract critical insights from unstructured data. For instance, Opus EHR's Copilot AI captures and organizes clinical notes during sessions, cutting charting time by 40% while improving the quality of documentation [4].
Natural Language Processing (NLP) adds another layer of capability, pulling meaningful insights from unstructured clinical notes and spotting patterns that might go unnoticed during manual reviews [16]. These algorithms can detect subtle shifts in a patient’s language or behavior that signal potential risks, allowing for early intervention [16]. As Judd Carey, Director of Operations at VirtualServices, Mindful Health, explains:
"By automating the quality of internal data, and applying an algorithm, it will cut back on errors to not miss a thing, especially from group sessions" [3].
With the growing emphasis on value-based care models, these AI features are becoming indispensable. As Pay-for-Performance reimbursement gains traction, providers increasingly rely on accurate, real-time outcome data to demonstrate their clinical effectiveness [5]. AI-powered systems now automate tasks like sending secure assessment links to patients and integrating their responses directly into the EHR. This allows clinicians to track moods, behaviors, and progress in real time without additional workload [2]. Such automation not only supports quality care but also meets reimbursement requirements efficiently.
How Outcome Dashboards Reduce Clinician Workload
1. Automating Data Collection and Display
Outcome dashboards simplify the way clinicians interact with data by providing a single, automatically updated view of patient performance. This means providers no longer need to manually input or track data, as the dashboard reflects real-time updates with every change [8].
This automation translates into tangible time savings. For instance, Opus Copilot AI reduces documentation time by up to 35% and speeds up charting by 40% [4].
With over 100 customizable assessment tools feeding data directly into the dashboards, clinicians can say goodbye to the tedious task of manual data aggregation [4].
The dashboards also handle compliance monitoring effortlessly. They track expiring treatment plans and ensure adherence to Medicaid, Medicare, JCAHO, and CARF standards without the need for manual audits [8].
By proactively managing these requirements, clinicians can avoid the stress of last-minute compliance checks while maintaining uninterrupted regulatory standards. This streamlined approach not only saves time but also creates a foundation for efficient, team-centered care.
2. Supporting Team-Based Care with Shared Dashboards
Beyond automating data collection, shared dashboards enhance collaboration by giving the entire care team access to the same real-time information.
Therapists, case managers, and clinical directors can work from a single source of truth, improving coordination and decision-making [7][8]. Deborah V., a Clinical Director, highlights this benefit:
"The ability to cross reference clinical, case management, medical and demographic information within the client file is a true benefit for clinical collaboration" [3].
This shared access allows the team to act quickly when needed. For example, automatically updated assessment results ensure that critical warning signs, like abnormal anxiety or depression scores, are addressed promptly [2][5].
Supervisory dashboards add another layer of functionality by enabling clinical directors to oversee team productivity and track documentation completion rates [8].
This bird’s-eye view helps pinpoint areas where focused leadership can enhance team performance - without the need to micromanage individual providers. By keeping everyone on the same page, these dashboards support a more cohesive and effective care environment.
Conclusion:
EHR data visualization is transforming the way behavioral health providers measure outcomes. By replacing tedious manual tracking with automated dashboards, clinicians can instantly spot critical trends - like patients not responding to treatment plans or sudden changes in anxiety levels. This shift allows for quicker, more accurate interventions.
But the benefits don't stop there. Operational efficiency takes a leap forward as clinicians save valuable time for patient care. Meanwhile, compliance becomes almost effortless, with dashboards automatically monitoring treatment plan expirations and regulatory requirements - no need for manual audits[8].
Team-based care also gets a significant boost. Shared dashboards break down information silos, helping therapists, case managers, and clinical directors work together seamlessly. Real-time access to assessment results ensures teams can catch warning signs early and collaborate to prevent crises before they escalate.
In the era of value-based care, measuring outcomes isn’t optional - it’s essential. Pay-for-Performance reimbursement demands clear, measurable improvements. Visualization tools make this achievable by tracking standardized assessments like PHQ-9 and GAD-7, providing the evidence needed to demonstrate treatment effectiveness to both clinical and financial stakeholders.
Ultimately, these measurable outcomes highlight the importance of a strong EHR platform. To thrive in value-based care, providers should choose systems that offer real-time, automated visualizations, customizable assessment tools, and AI-driven automation. The right platform ensures your practice continues to grow while keeping patient outcomes front and center.
FAQs
How can EHR data visualization help improve patient outcomes in behavioral health?
EHR data visualization takes complicated patient information - like clinical notes, assessment scores, and treatment progress - and turns it into easy-to-understand, interactive dashboards.
These tools allow behavioral health providers to quickly spot trends, such as worsening symptoms, skipped appointments, or issues with medication adherence. By identifying these patterns early, clinicians can make real-time adjustments to treatment plans, helping patients stay on track and achieve better outcomes.
Opus Behavioral Health EHR streamlines this process with built-in features that automatically gather and present patient progress in visual reports. This gives providers a clear picture of both individual patient journeys and the overall success of their programs. With this data, they can make informed decisions to improve care quality, increase patient engagement, and achieve stronger recovery results.
What makes a great EHR outcomes dashboard for behavioral health providers?
An EHR outcomes dashboard tailored for behavioral health providers should offer clear, actionable insights through intuitive and interactive visual tools. It needs to seamlessly pull essential metrics - like assessment scores, treatment progress, and demographic information - straight from the EHR system.
This ensures the data remains accurate and always up-to-date.
The dashboard should include real-time visualizations like charts, heatmaps, or trend lines, making it easier to spot patterns and dig deeper into individual patient records when necessary. Clinics can benefit from customizable KPIs, such as remission rates or patient-reported outcomes, to focus on their most critical metrics and compare them against benchmarks.
On top of that, integrated alert systems can highlight patients requiring immediate attention, enabling prompt and effective interventions.
When paired with a user-friendly platform, like Opus Behavioral Health EHR, such dashboards enable providers to track clinical outcomes, meet compliance standards, and enhance care delivery through data-driven decision-making.
How does predictive analytics help manage risks in behavioral health care?
Predictive analytics taps into data from electronic health records (EHRs) to pinpoint patients who might be at a higher risk for relapse, hospitalization, or other serious health issues.
By examining historical clinical records, demographic details, and utilization patterns through advanced algorithms, healthcare providers can group patients based on their risk levels.
This approach helps focus attention and resources on those who need them the most.
Spotting risks early means healthcare teams can take action ahead of time - whether that's adjusting medications, reaching out to patients directly, or providing additional therapy.
These proactive steps can prevent crises, leading to better patient outcomes while also cutting down on emergency visits and hospital readmissions. The result? Improved care and a more efficient use of financial resources.
Opus Behavioral Health EHR takes it a step further by embedding AI-powered analytics into its platform. With real-time dashboards displaying predictive risk scores and outcome metrics, providers get the tools they need for quicker decisions, smoother workflows, and ongoing trend monitoring. This empowers them to deliver care that's not only more efficient but also more impactful.
