
When psychiatric units run above 85% staffed-bed occupancy, pressure builds fast.
Bed occupancy forecasting helps behavioral health leaders see that pressure before it turns into ED boarding, delayed admissions, staffing strain, or discharge backups.
At a basic level, the article shows that better forecasts depend on a few clear rules: measure occupancy against staffed beds, not licensed beds; use clean ADT, census, LOS, transfer, and authorization data; and match the forecast window to the decision.
A 72-hour to 7-day view helps with staffing and bed flow. A 30- to 180-day view helps with service line and scheduling decisions. Longer-range views support budgeting and growth planning.
Here are the main takeaways:
- Occupancy rate is only useful if bed definitions are correct. A 40-bed unit staffed for 32 beds with 30 occupied beds is at 94%, not 75%.
- The 85% threshold matters. Many psychiatric settings treat it as the upper safe limit because reserve capacity starts to disappear above that point.
- Short-term forecasts need more than census. Admissions, discharges, transfers, LOS patterns, payer authorizations, waitlists, referral volume, and day-of-week trends all affect bed flow.
- Behavioral health demand is not flat. Weekend discharge slowdowns, court-related admissions, seasonal swings, and step-down delays can shift occupancy within days.
- Not every provider needs a complex model. Smaller centers may get useful results from rolling averages and weekly review. Larger systems may need SARIMA, tree-based models, or deeper analytics support.
- Dashboards matter only if they drive action. Forecasts should link to intake pacing, discharge review, ED boarding response, and unit-level bed management.
- Data limits still matter. Staffing gaps, policy shifts, and weak cross-site definitions can reduce forecast accuracy, especially near full capacity.
For behavioral health executives, the message is simple: forecasting is less about perfect prediction and more about earlier action. The most useful process is the one that helps teams act before a unit reaches crisis capacity.
The data and metrics needed for accurate occupancy forecasts
Core inputs: census, admissions, discharges, transfers, and length of stay
Accurate occupancy forecasting starts with disciplined data.
Behavioral health leaders need the same core inputs used the same way across units: daily census, admissions, discharges, transfers, length of stay, and payer authorizations.
Daily census should be recorded at a fixed cutoff, often 11:59 p.m. It should also be split by unit and patient type so inpatient, observation, and step-down levels of care are not grouped together. That sounds basic, but when categories blur, forecast accuracy slips fast.
Admissions data should include timestamps and source tags such as the ED, outpatient, court, or a referral partner. Discharge data should separate planned from unplanned discharges and record disposition, including home, residential, jail, or readmission. Transfers should show the origin unit, destination unit, and exact date and time. Without that detail, internal bottlenecks can stay hidden until census pressure builds.
Payer authorization data also belongs in the forecast model. The data should include the initial approved period, renewal dates, and denials. In many psychiatric and SUD programs, authorization timing affects discharge timing. When several authorizations expire in the same week, discharge activity can bunch together and change bed availability with little warning.
Length of stay, or LOS, needs a more careful view than a single average. Behavioral health stays are rarely even. Many patients may stay 3 to 7 days, while a smaller set stays much longer. Percentiles such as P50, P75, and P90 give a clearer picture of both normal flow and long-stay pressure.
A 2016/17 analysis of mental health inpatient capacity in England found a mean LOS of about 7 weeks but a median of 4 weeks, with more than one-third of patients discharged within 2 weeks and 7% still hospitalized after 6 months.[2][6] That gap matters. Long-stay patients tie up beds no matter how many new admissions are waiting, so LOS distribution is a direct input when estimating when beds may open.
Many treatment centers also track a small set of pressure indicators to spot strain before it appears in the census.
Pressure indicators:
-
Bed occupancy rate
-
Occupied bed days or bed hours
-
ED boarding time
-
Waitlist volume
These metrics describe current flow. Demand signals help show what may change next.
Demand signals that shift occupancy in psychiatric and SUD programs
Static averages miss the rhythm of behavioral health operations. Occupancy often moves because of repeated demand patterns, not random variation.
Day-of-week trends are one of the clearest examples. One study found that only 4.7% of psychiatric discharges occurred on weekends while 19.9% of admissions happened on weekends.[9] That mismatch often pushes occupancy up at the start of the week, even when average weekly volumes look stable on paper.
Seasonality also affects psychiatric utilization. A systematic review of more than 1.4 million serious mental illness admissions found clear spring and summer peaks in psychiatric hospitalizations.[4] Manic episode admissions tend to peak in summer, while bipolar depressive episodes show higher admissions in autumn and spring.[3]
Other demand signals can shift occupancy just as fast:
-
Referral source volume
-
Court-related admissions and legal status
-
Payer authorization timing
-
Changes in community programs
For example, if a local crisis stabilization unit closes or a major referral partner changes staffing, inflow can move within days. Court-mandated or forensic admissions may arrive in clusters tied to court schedules and often come with longer LOS. Authorization cycles can create discharge spikes when many approvals expire at once.
When the EHR also includes diagnosis mix, acuity scores, legal status, and substance use characteristics, forecast accuracy often improves. High-acuity admissions, involuntary holds, and co-occurring SUD diagnoses are each linked to longer stays and harder discharge planning. A simple admissions count will not show that difference.
These patterns shape the short-term forecasts used for daily staffing, bed management, and weekly planning.
Using integrated EHR reporting as the data source of record
Occupancy forecasting works better when one reporting source drives the conversation. Behavioral health teams need shared definitions so nursing, case management, utilization review, admissions, and finance are not working from different numbers.
A behavioral health EHR like Opus Behavioral Health EHR brings census, admissions, discharges, transfers, authorizations, and outcomes data into one system. Teams can schedule automated reports by unit, payer, or program, with updates delivered daily or in real time. That supports faster operational review and cuts down on manual reconciliation.
Opus also links EHR data with CRM and RCM workflows. That gives leaders a clearer view of referral volume trends and authorization status alongside clinical census data instead of leaving those inputs in separate systems. Shared reporting logic across departments can reduce discrepancies and support cleaner forecast inputs.
|
Data Element |
Primary Source System |
Forecasting Use Case |
|---|---|---|
|
Daily Census |
EHR (Census/ADT Module) |
Real-time capacity management and daily staffing |
|
Admissions (by unit and source) |
EHR / CRM (Intake) |
Short-term inflow modeling; referral pattern analysis |
|
Discharges (planned vs. unplanned) |
EHR (Discharge Planning) |
Outflow forecasting; readmission risk flagging |
|
Transfers (unit-level moves) |
EHR (ADT) |
Identifying internal bottlenecks between levels of care |
|
Length of Stay Distribution |
EHR / Billing |
Estimating future bed availability; flagging long-stay patients |
|
Payer Authorizations |
RCM / Utilization Review |
Predicting discharge timing around authorization expirations |
|
Waitlist Volume |
CRM / Intake |
Short-term demand signaling for the next 7–14 days |
|
Referral Source Volume |
CRM |
Tracking inflow trends from key feeder programs |
|
Acuity / Legal Status |
EHR (Clinical Assessments) |
Adjusting LOS estimates by patient cohort |
Forecasting methods and horizons for inpatient decision-making
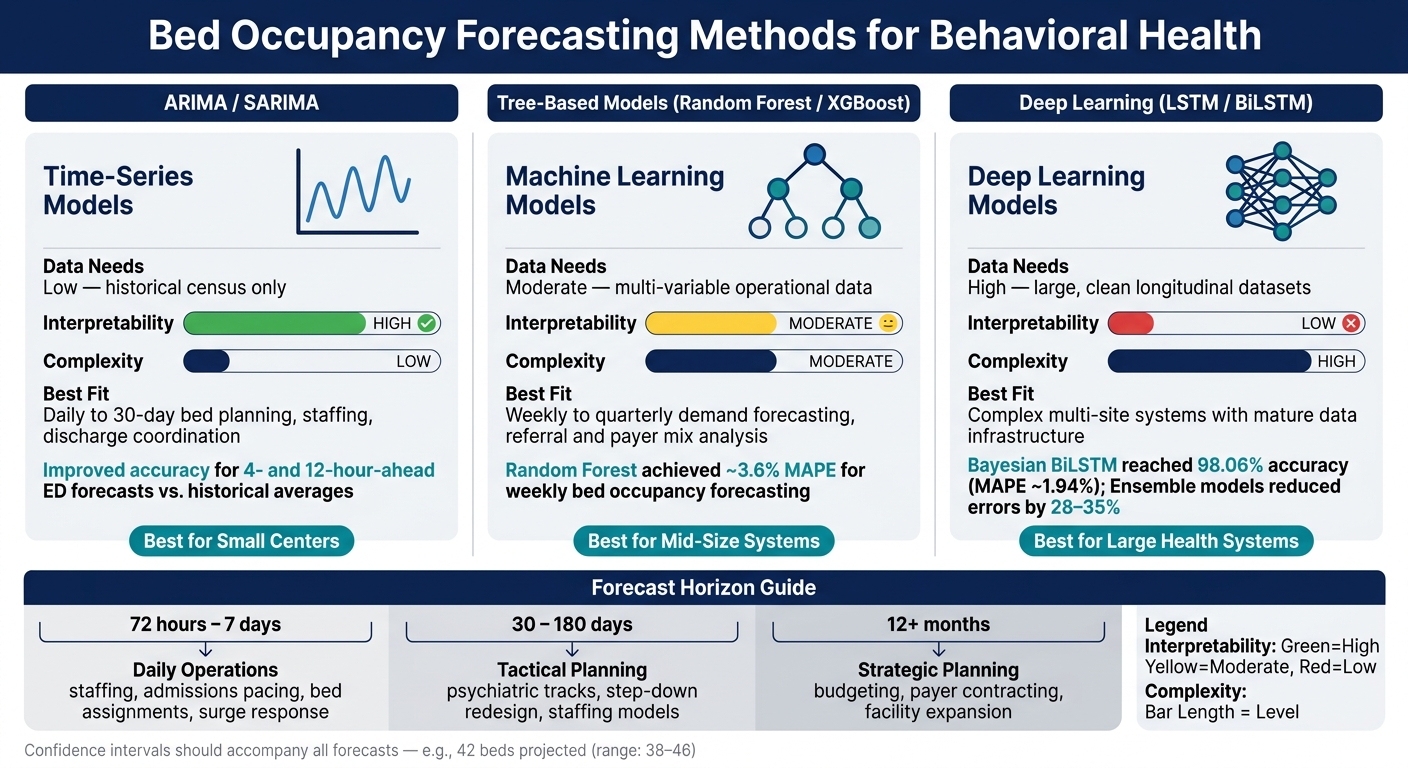
Bed Occupancy Forecasting Methods: Choosing the Right Model for Your Behavioral Health Organization
Short-term methods for daily and weekly bed planning
Once the data foundation is set, the next step is choosing a forecast method that fits the decision at hand. The model should follow the use case, not the other way around. In inpatient behavioral health, that usually means aligning the forecast to staffing, admissions pacing, discharge coordination, or longer-range capacity planning.
For most organizations, time-series models are the right starting point before moving into machine learning. Moving averages can smooth day-to-day census swings. ARIMA and SARIMA are often a good fit when teams need to account for repeating weekday, weekend, and holiday patterns. Research on ED bed occupancy found that seasonal ARIMA models improved forecast accuracy for 4- and 12-hour-ahead forecasts compared with simple historical averages.[13][15]
These models often work well across a 72-hour to 30-day planning window. They also tend to be practical for behavioral health providers with small analytics teams that need useful forecasts without a heavy technical lift.
Advanced models for weekly to quarterly forecasting
When occupancy is driven by several variables at once, more advanced models may help. Referral volume, admission source, payer mix, and discharge timing rarely move in a straight line. In those cases, Random Forest, Gradient Boosting, and XGBoost can pick up patterns that SARIMA may miss.
One study found that Random Forest reached a MAPE of about 3.6% for weekly bed occupancy forecasting, beating the other models tested.[11][12] For leaders managing weekly demand shifts, that level of accuracy can support tighter staffing plans and better visibility into bed pressure.
Deep learning architectures such as LSTM and BiLSTM may push accuracy further, but they come with tradeoffs. A Bayesian BiLSTM model for weekly mental health bed occupancy reached 98.06% accuracy with a MAPE of approximately 1.94%.[8][7] That said, these models need large, clean datasets, steady technical support, and stronger governance around model maintenance. They are also harder to explain in executive and operational settings, which matters when leaders need to trust the output before acting on it.
An ensemble model that combined XGBoost, Random Forest, and LSTM reduced prediction errors by 28% to 35% compared with the best single algorithm.[14] Still, that kind of setup is usually more realistic for larger health systems with dedicated analytics staff and a mature reporting environment.
The choice comes down to two practical questions: How far ahead does the team need to plan, and how much data can the organization reliably maintain?
|
Method |
Data Needs |
Interpretability |
Complexity |
Best Fit |
|---|---|---|---|---|
|
ARIMA / SARIMA |
Low - historical census only |
High |
Low |
Daily to 30-day bed planning, staffing, discharge coordination |
|
Tree-based (Random Forest, XGBoost) |
Moderate - multi-variable operational data |
Moderate |
Moderate |
Weekly to quarterly demand forecasting, referral and payer mix analysis |
|
Deep Learning (LSTM, BiLSTM) |
High - large, clean longitudinal datasets |
Low |
High |
Complex multi-site systems with mature data infrastructure |
Matching forecast horizons to operational, tactical, and strategic decisions
Forecast horizon should match the decision it is meant to support. A mismatch here can make even a strong model less useful. A forecast built for next quarter will not help a charge nurse manage tomorrow morning’s bed board, and a 72-hour forecast will not guide facility expansion.
In practice, the planning window often breaks down like this:
- A 72-hour to 7-day forecast supports daily operations, including staffing changes, admission pacing, bed assignments, and surge response.
- A 30- to 180-day forecast supports tactical planning, such as whether to add a psychiatric track, redesign a step-down unit, or adjust staffing models.
- A 12-month or longer forecast supports strategic planning, including budgeting, payer contracting, and facility expansion.
Every forecast should include a confidence interval. A range gives leaders more decision support than a single number because forecast error grows over time.
For example, a projection of 42 beds occupied next week with a range of 38 to 46 gives managers a clear trigger point. If the upper bound starts getting close to staffed capacity, teams can speed up step-down placements or line up contingency staffing before operations tighten.
Confidence intervals do not signal a weak model. They reflect uncertainty in a direct, usable way, which can help behavioral health leaders act earlier rather than react later.
Integrated reporting from Opus Behavioral Health EHR can centralize the census, admissions, discharges, transfers, and authorization data these models rely on. Forecasts only become useful in day-to-day operations when teams can see them inside daily dashboards and bed management reports.
Putting forecasts to work through dashboards and inpatient use cases
Use cases: admissions planning, ED boarding reduction, and step-down coordination
A forecast only matters if it shows up inside the bed-management workflow. In inpatient behavioral health, near-term forecasting becomes useful when it shapes daily decisions about who can be admitted, where beds should be held, and which discharges need attention first. The clearest use cases are admission pacing, ED boarding reduction, and step-down coordination.
For admission pacing, a 7-day occupancy forecast gives intake teams a clear decision point. If projected occupancy moves above 90%, teams can slow new admissions, redirect lower-acuity referrals, and review patients who may be ready for discharge.
In detox settings, the same approach can guide bed allocation. When occupancy is projected to run high, programs may hold beds for patients in severe withdrawal or those arriving through the ED.[18]
Reducing ED psychiatric boarding works much the same way. If a 3-day forecast shows an acute psychiatric unit moving toward 95% occupancy, bed management has time to act before the pressure peaks. That may include speeding up discharges, finishing weekend authorizations, and opening beds ahead of expected ED demand.[1][17]
Step-down coordination is strongest when forecasted occupancy is matched with expected LOS by unit. Shared visibility across levels of care matters here.
If a weekly forecast shows a high-acuity adult unit staying above 90% while a subacute unit is expected to open several beds in that same period, case managers can line up transitions ahead of time, arrange transportation, and confirm authorizations before the move. Detox programs can also match completion dates with open residential SUD capacity, which helps reduce handoff gaps.[20][21][19]
Key dashboard views for behavioral health bed management
To make these actions repeatable, dashboards should track the same signals used in the forecast. The table below outlines the main panels behavioral health leaders should set up, along with the metrics, data sources, and users tied to each view.
|
Dashboard Panel |
Core Metrics |
Primary Data Sources |
Users |
|---|---|---|---|
|
Unit Occupancy & Capacity |
Occupancy rate (%); staffed vs. designated beds; threshold flags (>90%) |
Inpatient census; EHR bed master; staffing roster |
Nurse managers; bed coordinators; ops leaders |
|
Forecasted vs. Actual Occupancy |
Forecasted daily/weekly occupancy by unit; prediction intervals; variance vs. actual |
Forecasting engine; admissions/discharge logs |
Capacity management; finance; senior leadership |
|
LOS Distribution & Long-Stay Patients |
Average/median LOS; % of patients staying >30, >60, >90 days |
EHR encounter data; outcomes registry |
Medical directors; case managers; utilization review |
|
Turnover & Discharge Timing |
Daily admissions/discharges/transfers; discharge time of day; weekend vs. weekday discharges |
EHR; ADT feed |
Bed management; social work; discharge planners |
|
ED Boarding & Access |
Boarding hours; boarded behavioral health patients; time-to-bed after admission decision |
ED tracking system; inpatient census; escalation logs |
ED leadership; psychiatric service line leaders |
|
Waitlist & Referral Mix |
Waitlist count by program; average wait time; referral source mix (ED, community, justice) |
Intake/CRM; referral tracking; EHR |
Intake coordinators; outreach; community liaison |
Each panel should also allow unit-level filters for adult, adolescent, geriatric, forensic, and SUD programs. These populations do not move through care in the same way. LOS patterns, discharge routes, and authorization rules can vary sharply by program, and a single rolled-up view often hides the pressure points that matter most to a program director or charge nurse.[21][19]
How live reporting supports daily action
The most useful dashboards combine historical patterns, current census, and near-term risk in one place. Historical reporting shows normal demand cycles and helps teams compare current conditions against past performance. Live census data, updated through admission, discharge, and transfer activity, shows the immediate state of each unit.[22][21]
The near-term forecast layer is what turns the dashboard from a reporting tool into a daily operating tool. A 7-day risk flag showing occupancy above 95% gives leaders a direct signal to start predefined actions, such as expedited discharge review, contingency staffing, or diversion protocols.[18][16]
Opus Behavioral Health EHR reporting can bring together live census, authorization status, payer mix, and utilization trends that affect discharge timing and bed turnover.[10][19] When authorization status, payer mix, and forecasted occupancy appear in one view, bed management and utilization teams can work from the same data instead of sorting through separate reports.
Implementation limits in small and large organizations, plus conclusion
Common limits: staffing gaps, small datasets, and policy changes
Even a strong forecasting process can lose accuracy when staffing patterns, payer policy, or data rules shift faster than the historical data can catch up.
One of the biggest issues is bed availability. Forecast accuracy depends on staffed capacity, not licensed capacity. Nationally, about 18% of licensed psychiatric beds were not operational at a point in time because of staffing shortfalls.[23] That distinction matters. A treatment center may appear to have open beds on paper, while operations teams know those beds cannot be used safely.
Capacity pressure also changes how leaders should read the forecast. When staffed occupancy is already above 85%, forecasts are better used as trigger points than precise counts. An NHS analysis found that bed occupancy forecasting models were accurate within a broad threshold about 77.8% of the time, but only 40% of the time when measured against strict thresholds.[26] In plain terms, the closer an organization gets to full capacity, the less room there is for error and the more costly a bad call becomes.
Historical patterns can also break when the operating environment changes. Policy updates, payer rules, LOS policies, reimbursement shifts, and changes in involuntary-admission patterns can all reset demand. When that happens, leadership teams should mark the change date clearly and move from straight historical forecasting to scenario planning.
These limits affect how much process discipline a small center or a multi-site behavioral health system can keep in place without adding friction.
What changes between a small center and a multi-site system
The main difference is governance and standardization.
A small center can often run a useful forecasting process with a weekly 30-minute huddle, a basic EHR report that shows the past few weeks of daily census, and a simple rolling average for the next two to four weeks. In many cases, weekly review plus manual adjustments for known events, such as a new referral source or a seasonal spike, will beat a machine-learning model when historical data is limited.
A multi-site system needs more structure. Without shared definitions, cross-site reporting can become hard to trust. That problem shows up fast when sites define core terms differently, including:
- what counts as a staffed bed
- how same-day admissions and discharges are recorded
- whether patients boarding in the ED are included in the inpatient census
The table below shows where those operating differences tend to appear.
|
Implementation Area |
Small Center |
Multi-Site System |
|---|---|---|
|
Governance cadence |
Weekly census huddle; informal review |
Monthly rolling forecast reviews; quarterly model performance checks |
|
Forecasting method |
Rolling averages; basic trend adjustments; clinician judgment |
Time-series models (ARIMA, seasonal); regression with external drivers; ML where data supports it |
|
Data standardization |
Single EHR source; manual validation |
Standardized definitions across sites; central data pipelines; formal bed-status workflows |
|
Dashboard scope |
Unit-level census, 7–14 day forecast, threshold flags |
Site-level and system-level views; cross-site load balancing; drill-down by unit and program |
|
Analytics ownership |
Clinical or ops director with basic analytic support |
Dedicated analytics team; shared ownership across ops, finance, and clinical leadership |
Conclusion: the practical path to better bed forecasting
Once leaders understand the limits, the next step is execution.
The most useful forecasting process starts with staffed-bed occupancy, clean real-time ADT data, and a forecast horizon that matches the decision at hand. Short-term forecasts, usually 1 to 14 days, support day-to-day staffing and bed management. Medium-term windows, often 4 to 12 weeks, help with scheduling and referral planning. Longer-range views are more useful for capacity planning and hiring.
The point is not to build a forecast that looks impressive in a dashboard. The point is to give operations, clinical, and executive teams a forecast they will actually use. In behavioral health settings, that usually means a forecast tied to huddles, trigger thresholds, and discharge workflows so teams can respond before pressure turns into ED boarding, admissions bottlenecks, or delayed discharges.[24][5][25]
FAQs
How do we calculate bed occupancy correctly?
Calculate bed occupancy using consistent census tracking across every level of care, including Detox, Residential, PHP, IOP, and Outpatient. A real-time, centralized census should record each admission, discharge, and bed assignment so operators can view current capacity without relying on manual updates or disconnected spreadsheets.
With Opus Behavioral Health EHR, bed assignments and clinical episodes can flow into reporting dashboards directly. That can help stakeholders see capacity and utilization more clearly across programs, locations, and care settings.
Why is 85% occupancy a key threshold?
The source material does not support 85% occupancy as a standard benchmark for inpatient mental health facilities.
It refers to other 85% targets, such as a goal for same-day documentation completion, but it does not explain, justify, or cite 85% occupancy as an operating threshold. As written, that occupancy figure is not backed by the provided materials.
For behavioral health leaders, that distinction matters. Occupancy benchmarks can affect staffing plans, bed management, access, and financial planning. If an article or internal memo presents 85% occupancy as a recognized standard, the claim should be tied to a source or removed to avoid overstating the evidence.
What forecast horizon should we use?
The right forecast horizon depends on the clinical and operational decision at hand. For near-term demand changes and scheduling adjustments, 7-day sliding windows often work well. They give behavioral health teams a close view of shifts in volume, staffing needs, and appointment flow without relying on stale data.
For relapse risk, dropout risk, or longer-range patient outcomes, a 90-day or 120-day window is often a better fit. That longer view can help keep the data tied to the time frame that matters for care planning, outreach, and follow-up.
Whatever horizon a provider chooses, real-time dashboards still matter. They can help teams track patterns as they change, spot capacity issues early, and respond before those issues start to affect staff efficiency, access to care, or patient outcomes.



- Behavioral Health
- EHR Systems
- Addiction Treatment EHR
- mental health
- Telehealth
- addiction treatment
- Behavioral health facility
- Substance Abuse Disorder
- behavioral Health center
- HIPPA Compliant
- ehrsoftware
- PTSD
- behavioral health ehr
- Depression
- hipaa
- Anxiety
- MentalHealthMatters
- RCM
- claim denials
- clinical documentation
- mental health awareness
- screening tools

September 15, 2026

September 15, 2026

September 14, 2026

September 11, 2026

September 10, 2026

September 09, 2026
Recommended Posts
Friday, September 11, 2026
AI Risk Models for Suicide and Relapse
Suicide risk models and relapse risk models should not be treated as the same tool.

Monday, June 22, 2026
Want Fewer Billing Delays? Modernize Your EHR Mental Health Records
Billing delays in mental health practices can disrupt cash flow, increase administrative costs, and harm patient trust. ...
Wednesday, September 09, 2026
Guide: VR gamification in adolescent care
VR gamification in adolescent care works best when it targets one clear treatment goal, uses short supervised sessions, ...