

Payment posting problems often show up before A/R gets worse.
For behavioral health leaders, the six metrics that matter most are: auto-post rate, unapplied cash, days to post, adjustment variance, first-pass match rate, and exception volume by payer.
These metrics help executive teams see three things fast:
How fast remittances are postedHow accurate payments and adjustments are
How much manual follow-up is building by payer, program, or site
A billing team may post one commercial payer in 1–2 days while a Medicaid plan takes 5+ days and leaves more cash in suspense.
That gap can distort cash reporting, delay denial work, and leave too little time before a 90-day filing limit closes.
Behavioral health organizations should track these six KPIs together, not as isolated numbers. A drop in first-pass match rate can lead to a lower auto-post rate, more exceptions, higher unapplied cash, and slower days to post.
In the same way, a clean post does not always mean a correct payment, which is why adjustment variance also matters.
The clearest view comes from a payer-level dashboard split by payer, service line, and location.
That helps treatment centers spot where workflow gaps, contract issues, authorizations, telehealth modifiers, visit caps, or remittance mapping problems are affecting cash flow and staff workload.
Why Payment Posting Metrics Need Their Own Dashboard
Aggregate RCM reports often blur the problems leaders need to see.
A behavioral health organization may show a healthy 28-day average for payment posting across commercial payers while carrying a 65-day average with a Medicaid managed care plan. In an aggregate report, that gap can disappear.[8] A dedicated dashboard makes those differences visible by payer, plan, and service line.
That matters because payment posting is not a single task with a single outcome.
It affects cash visibility, denial follow-up, patient balances, and the quality of downstream reporting. When executive teams review payment posting in one combined average, they may miss the exact payer relationships or program lines that are slowing down cash or creating rework.
The dashboard should track three issues: posting speed, posting accuracy, and exception resolution.
These three dimensions shape payment posting quality, and each one affects a different part of the revenue cycle.
|
Dimension |
What It Measures |
Why It Matters |
|---|---|---|
|
Speed |
Time between receiving an ERA/EOB and posting it |
Supports faster reconciliation and earlier cash visibility.[1] |
|
Accuracy |
Whether payments and contractual adjustments match payer contracts exactly |
Prevents false patient balances and distorted revenue projections.[2][6] |
|
Exception Resolution |
How quickly denials are discovered, categorized, and routed |
Helps surface recurring payer issues before they repeat across hundreds of claims.[1] |
When posting is inaccurate, the damage does not stay in the back office. It can create false patient balances, send staff into the wrong collection follow-up, and skew what finance leaders think is collectible.[6]
In behavioral health, where authorizations, level of care, and payer rules often vary by program, even small posting errors can spread across many claims before anyone catches them.
The denial side is just as time-sensitive. Every day it takes to identify a zero-pay claim brings the organization closer to the payer's filing deadline. If a practice takes 60 days to notice a denial and the payer's filing limit is 90 days, only 30 days remain to respond.[6] That delay can turn a recoverable denial into a write-off risk.
Benchmarks matter less than payer-level and service-line trends. Behavioral health organizations often have payer mixes, Medicaid volume, and service complexity that make one broad benchmark hard to trust. IOP, PHP, and telehealth can each produce different posting patterns and different denial behavior.[1][2][10]
A more useful approach is to track internal trends over time, broken out by payer and service line, so leaders can spot drift before it shows up in A/R.
The six metrics that follow help separate speed, accuracy, and exception problems early, before they become larger A/R issues.
1. Auto-Post Rate
Auto-post rate tracks the share of ERA/EOB payments a system posts to claims without staff intervention. Behavioral health operators can measure it by claim count or by dollar amount, and both views matter. A center may post a high share of claims by volume while still missing a meaningful share of cash by dollars, or the reverse. That gap often helps RCM teams spot where posting logic is failing.[2][5]
For most organizations, 90% or higher is a healthy target. A rate below 80% should be treated as a warning sign.[5] When performance slips, the root cause often sits in payer rule setup, claim configuration, or authorization data.
Behavioral health billing adds a few common trouble spots. Time-based CPT codes such as 90832, 90834, and 90837 often create posting mismatches when telehealth modifiers do not line up exactly between the submitted claim and the payer record.[5] Authorization issues are another frequent source of failure. Concurrent reviews, changing level-of-care support, and mid-course authorization updates can lead to partial payments or zero-pays that the system cannot post cleanly.[10] Visit limits and frequency caps can create the same problem when posting logic does not match the payer’s adjudication pattern.[1]
To find the source of the problem, revenue cycle leaders should review auto-post performance by:
PayerService line
Location
Those cuts can help teams isolate failures tied to file formats, authorization mismatches, unit counts, or intake data quality.[1][10][11]
When auto-post rates stay low, staff usually inherit more exception work, more manual reconciliation, and more unreconciled cash moving into the next KPI.
2. Unapplied Cash
When payments do not auto-post, they often move into unapplied cash. Unapplied cash is money a behavioral health organization has received but has not tied to a specific claim or patient account. It usually sits in a suspense account and remains unreconciled against an ERA or EOB.
Teams should track it in two ways: as a dollar amount and as a percentage of total cash receipts using this formula: (Total Unapplied Cash ÷ Total Cash Receipts) × 100.
This backlog does more than slow posting. It can blur actual cash performance, delay month-end close, and create billing mistakes that weaken confidence across finance, billing, and operations.
Common causes include payer underpayments, mismatched remittances, manual posting mistakes, and incomplete ERA/EOB mapping. In behavioral health, the problem often shows up around partial payments, multi-service claims, and zero-pays closed without a reason code. Zero-pays closed without a reason code can stay unresolved and inflate suspense balances. [1]
To see where unapplied cash is building up, reporting should be broken out by payer, service line such as IOP, PHP, MAT, or outpatient, location, and aging bucket of 0–30, 31–60, and 61–90 days. [10][12]
A three-business-day threshold can help teams catch backlog before it distorts cash visibility. Any remittance that is not fully posted within three business days should be flagged and routed to AR or coding.
3. Days to Post
Once cash becomes unapplied, the next issue is timing. Days to post tracks how long it takes to move a payment from receipt into the billing system. The standard formula is (Date of Posting) – (Date of Remittance Receipt or Bank Deposit).
For ERA/EFT payments, the clock starts when the electronic file arrives or when funds hit the bank. For paper EOBs and checks, it starts when the mail is received or the check is deposited. That gap is what Days to Post is designed to show. [1][13]
A common benchmark is to post 95% of ERAs within 48 hours and paper EOBs within 5 business days. When posting falls behind, the downstream effect is hard to miss. Follow-up slows down, patient statements go out later, and finance leaders lose clear near-term cash visibility. [1]
In behavioral health, posting delays often tie back to workflow friction that is specific to the setting. Telehealth modifier and POS review can slow payment posting. So can bundled claim interpretation and group therapy verification. Residential programs often see the longest delays because medical necessity review adds another layer before posting can move forward. [3][14]
Once the delay is visible, leaders should break out Days to Post by payer and site. That view helps show whether the bottleneck sits with remittance format, clinical review, or provider sign-off. In practice, this can show whether the delay is payer-specific, such as a Medicaid plan with hard-to-read remittance formats, or internal, such as a site where unsigned group notes hold up posting. [1][10]
4. Adjustment Variance
Adjustment variance shows whether payment posting lines up with contract terms or quietly leaks cash. It reflects the gap between contracted reimbursement and the amount actually allowed or paid. Teams should track Underpayment Rate as (Number of Underpaid Claims ÷ Total Paid Claims) × 100 [2]. On an executive dashboard, this metric can show whether payer pricing, contract loading, or adjustment logic is starting to drift.
Unlike denials, underpayments can post cleanly and still leave a shortfall [2].
In behavioral health, those shortfalls often come from contract and level-of-care complexity. Residential, PHP, and IOP per-diems can vary by payer and by contract version. Authorization limits, level-of-care modifiers, and carve-outs for lab or pharmacy can all send the wrong rate through the system [2][10].
The most useful way to monitor this metric is to break it down by:
PayerService line
Location [2][4]
That view helps finance leaders and RCM teams spot where a payer is paying below contracted rates on a repeated basis, or where one site shows recurring variance patterns that need review.
Treatment centers should also load contracted fee schedules into the billing system so the system flags allowed amounts below expected values [1]. That step can make adjustment variance visible before underpayments distort payer-level results.
Teams should track variance alongside first-pass match rate to separate pricing errors from claim setup problems.
5. First-Pass Match Rate
After adjustment variance, first-pass match rate shows whether claims were clean enough to pay the right way on the first try. First-pass match rate, sometimes called the first-pass payment ratio, measures the share of claims paid correctly on the first submission, without manual rework or appeal.
The formula is: (Claims Paid on First Submission ÷ Total Claims Submitted) × 100[3]. This metric shows how often clean posting starts at the front end, not just whether a claim was eventually resolved.
A rate above 90% is generally healthy, and 95% is strong. Once performance drops below 90%, rework costs can climb fast.[3][4] For behavioral health organizations, that line matters even more because claim denials occur at rates about 85% higher than in standard medical claims.[4]
In behavioral health, first-pass failures often trace back to a short list of operational issues:
Expired authorizationsVisit limit conflicts
Delayed secondary claims[1]
When first-pass match rate slips, leaders need to look at where the breakdowns are piling up. Lower rates tend to mean more manual touches, more exception volume, and more time spent fixing claims that were not ready for clean payment before the remittance ever reached posting.
Service-line visibility matters here.
Residential, detox, and outpatient should be tracked separately because blended rates can hide intake, authorization, or workflow issues at the site or program level.[3]
Claims with weak first-pass performance should then move into payer-level exception review, where RCM teams can spot repeat patterns and target the source of preventable rework.
6. Exception Volume by Payer
Once a team has reviewed first-pass match rate, the next issue is where posting exceptions are piling up. Exception volume by payer helps leaders see which insurers account for the most posting failures.
An exception is any remittance that cannot be posted cleanly, including partial payments, denials, underpayments, and remittance notes that need manual review before a claim can close [16]. The exception rate is calculated as (Exceptions ÷ Total Remittances Received) × 100 [1].
This metric matters because the cash impact shows up right away. When exceptions sit unresolved, secondary billing slows down and patient statements go out later than they should. Reworking a denied claim can cost $25 to $117, and preventable billing errors can consume up to 20% of potential revenue [4].
For behavioral health organizations handling hundreds of claims each month, those delays can turn into a serious drain on cash flow and staff time.
In behavioral health, exceptions often follow a familiar pattern. Common triggers include telehealth modifier and POS errors, authorization-to-billing mismatches, visit caps, and bundled-code conflicts [10][1].
Payers are also tightening timely filing limits to 90–120 days and increasing medical necessity reviews, which can push exception volume higher [15][7]. When this metric is reviewed alongside first-pass match rate, it becomes easier to tell whether the problem sits with a specific payer or reflects a broader workflow issue.
For this view to be useful, reporting should be segmented in three ways:
By payer to spot insurers with uneven adjudication patternsBy service line to separate outpatient, IOP, and PHP results
By location to identify front-end data capture issues at specific facilities [2][15][10][1]
A practical workflow rule can help keep exceptions from aging. Any claim that is not fully posted within three business days should be flagged and sent to AR or coding.
That rule should also be paired with mandatory zero-pay classification, so every zero-pay or partial-pay claim receives a denial or underpayment reason at the time of posting [1].
With that level of detail, executive teams can sort payer behavior from internal process breakdowns and direct follow-up where it belongs.
How to Read These Metrics Together
The main value comes from reading these metrics as one connected system, not six separate reports. On their own, each number says something. Read together, they show where cash posting is working, where it is slowing down, and where risk may be hiding.
These metrics work best as a sequence. First-pass match rate sets the upper limit for auto-post rate. When claims and remits match cleanly, payments post faster. When they do not, those items move into exception work. As auto-posting falls, the exception queue usually grows, and posting lag tends to grow with it. That pressure then pushes days to post higher.
Adjustment variance also needs close attention. An underpayment should move to exception review, not disappear into auto-posting. If it gets posted without review, the shortfall can be hidden. Unapplied cash can then make performance look better than it is. A deposit alone does not confirm correct reimbursement.
These metrics should be reviewed together, not in isolation. It also helps to break them out by payer and service line, such as IOP versus outpatient. That makes it easier to tell the difference between payer setup problems and workflow or documentation issues.
For example, a high exception volume for one payer paired with a strong first-pass rate often points to outdated payer mapping, not a broad process failure. That is the kind of view a dashboard should surface automatically.
Using Behavioral Health Software to Track Posting Performance
The next step is moving these metrics into one system that updates on its own. Payment posting is hard to manage when payer data, program data, and remittance activity sit across separate tools. A single behavioral health platform can bring EHR, CRM, and RCM data into one reporting view, which helps billing teams spot issues sooner and act before they spread across locations or levels of care.
Opus Behavioral Health EHR combines EHR, CRM, RCM, automated workflows, and reporting so billing teams can track auto-post rate, unapplied cash, days to post, adjustment variance, first-pass match rate, and exception volume by payer in one place. Teams can also filter by residential, IOP, outpatient, and telehealth to isolate metric drift and see where posting performance starts to slip.
Three capabilities tend to matter most:
Automated ERA importing can improve auto-post rate.Contracted rate loading can flag adjustment variance.
Exception workflows can route unmatched remittances before they turn into unapplied cash.
That gives billing teams faster posting and cleaner audit trails, while also giving revenue cycle leaders better visibility into where manual work is still slowing down cash posting.
Once the dashboard is live, teams can route sensitive and telehealth-related exceptions through the correct review path. For SUD appeals, route disclosures through HIPAA- and 42 CFR Part 2-compliant workflows [10]. Track telehealth denials tied to licensure and place-of-service rules [1].
Metric Summary Table
After reviewing each metric on its own, this table shows how the measures connect in day-to-day revenue cycle work.
For behavioral health leaders, it works as a quick operating guide: what each metric tracks, how to calculate it, and what kind of action it should prompt. Used this way, the table helps finance, billing, and operations teams spot workflow drift before it turns into cash posting delays, reporting issues, or payer follow-up work.
|
Metric |
Short Definition |
Sample Formula |
Healthy Signal |
Risk Signal |
Primary Action |
|---|---|---|---|---|---|
|
Auto-Post Rate |
% of payments posted automatically |
(Auto-Posted Payments ÷ Total Payments) × 100 |
Strong ERA mapping and enrollment |
More manual posting and possible ERA setup gaps |
Audit ERA mapping |
|
Unapplied Cash |
Cash received but not matched to a claim |
Unapplied cash balance |
Payments matched promptly |
Reconciliation failure; reporting risk |
Reconcile daily |
|
Days to Post |
Time from remittance receipt to posting |
Date posted minus date received |
Real-time financial visibility |
Delayed A/R visibility and less accurate aging |
Adjust posting cadence |
|
Adjustment Variance |
Gap between contracted and actual allowed amount |
Expected Allowed Amount - Actual Allowed Amount |
Strong contract adherence |
Possible underpayment or contract mismatch |
Escalate contract variances |
|
First-Pass Match Rate |
% paid correctly on first submission |
(Claims Paid on First Pass ÷ Total Claims Submitted) × 100 |
Clean intake and eligibility data |
Eligibility or authorization gaps driving rework |
Fix intake and VOB gaps |
|
Exception Volume by Payer |
Claims requiring manual review, by payer |
Count of claims in the exception queue per payer |
Smooth automation with minimal manual intervention |
Payer rule problems or mapping gaps |
Update payer rules |
Use these thresholds as a quick read on whether posting performance is drifting.
Payer-Level Scorecard Example
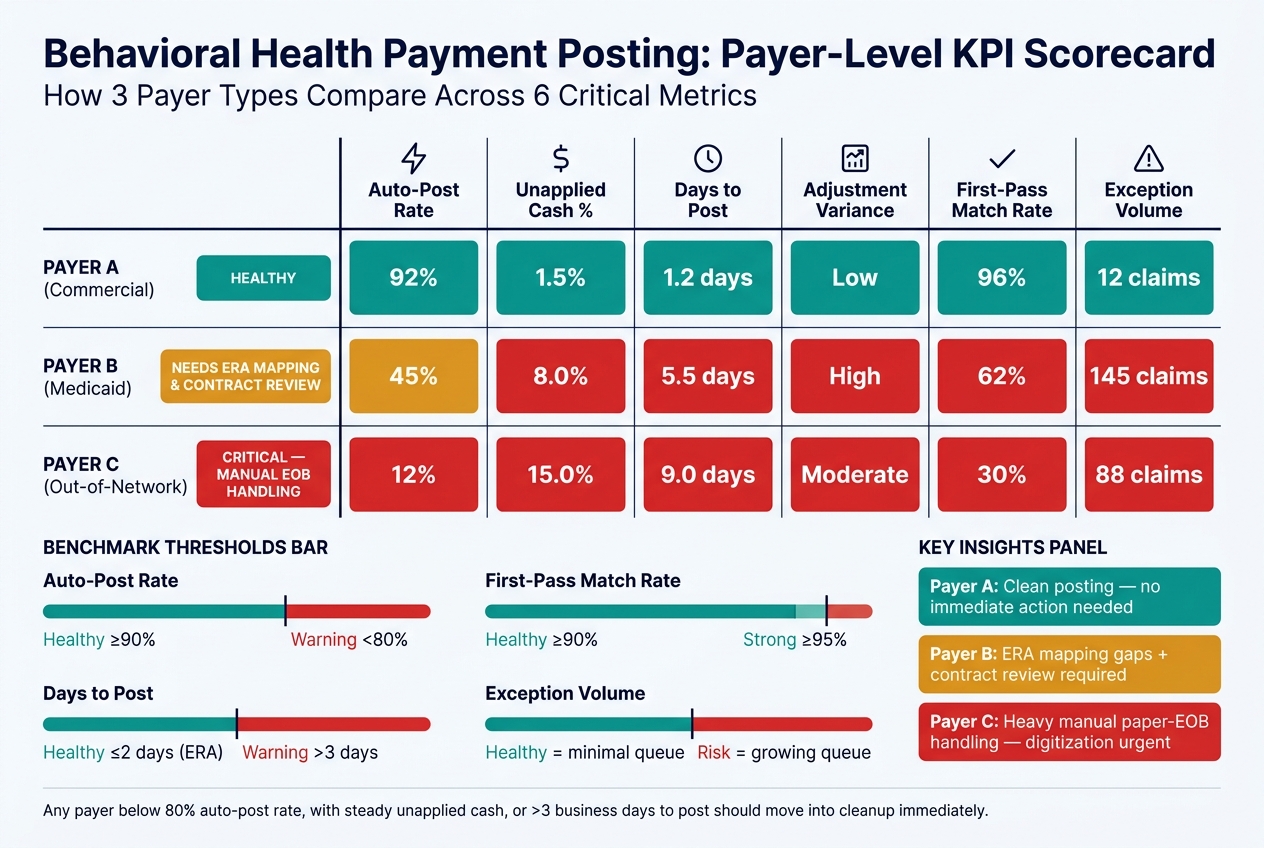
Behavioral Health Payment Posting: Payer-Level KPI Scorecard
These six metrics become far more useful when leadership teams review them payer by payer. A payer-level scorecard helps behavioral health organizations see which payers are driving manual posting delays, exception work, or revenue leakage.[2]
Here is an example of a working scorecard using realistic behavioral health payer data:
|
Payer Name |
Auto-Post Rate |
Unapplied Cash % |
Days to Post |
Adjustment Variance |
First-Pass Match Rate |
Exception Volume |
|---|---|---|---|---|---|---|
|
Payer A (Commercial) |
92% |
1.5% |
1.2 days |
Low |
96% |
12 |
|
Payer B (Medicaid) |
45% |
8.0% |
5.5 days |
High |
62% |
145 |
|
Payer C (Out-of-Network) |
12% |
15.0% |
9.0 days |
Moderate |
30% |
88 |
The pattern is easy to spot. The table shows where cash posting performance is stable and where payer workflows are breaking down.
Payer A looks healthy. Payer B points to a need for ERA mapping and contract review. Payer C suggests heavy manual paper-EOB handling and slow paper EOB digitization.
The scorecard also shows where issues should be escalated. When high adjustment variance appears alongside a low first-pass match rate, billing leaders and contracting teams should both review the payer.
One signal may point to underpayment risk, while the other may indicate claim-data errors or service-date mismatches.[2][3]
A weekly review cadence helps teams catch problems before they spread across month-end close, denial follow-up, or cash reconciliation. Quarterly audits of the top five payers can help confirm whether payer posting rules, contract terms, and exception workflows still line up with current billing activity.
Any payer below 80% auto-post, with steady unapplied cash or more than three business days to post, should move into cleanup.[9]
Conclusion
Strong payment posting programs stand on three traits: fast, accurate, and transparent. Speed on its own is not enough. If accuracy slips, teams can scale bad data. If visibility is weak, revenue leakage can sit in plain sight.
That is why these six KPIs deserve close attention. When leaders track them together, they can see where cash posts cleanly, where exceptions build up, and where follow-up is needed. Each KPI ties back to the same three themes running through this article: speed, accuracy, and exception resolution.
For behavioral health organizations, this matters even more. Payer rules are often hard to manage, and service-line complexity can make posting trends harder to read. High exception volume may point to workflow friction or rule tuning gaps.
High adjustment variance may signal the need for a contract or fee schedule review. Slow posting lag often points to the need for a tighter daily posting cadence.
Payer-level reporting is what turns those signals into action. Executive teams and revenue cycle leaders should review payer-level posting metrics every week, then meet monthly with billing leadership and AR managers to address workflow issues, automation gaps, or contract concerns. Used this way, payment posting becomes a revenue control point, not just a back-office task.
FAQs
Which payment posting metric should we fix first?
Start with expected vs. actual reimbursement. For behavioral health organizations, this is often one of the fastest ways to spot revenue leakage across high-volume payers and core service lines. When finance leaders compare what should have been paid against what was actually received, gaps tend to surface early.
From there, leadership teams can focus on the metric creating the most immediate operational strain. In many cases, that means payment posting accuracy or unapplied cash.
Both can slow down cash flow, create reporting noise, and make it harder for RCM teams to see where follow-up is needed. Opus Behavioral Health EHR supports this work through advanced reporting and automated workflows.
How often should we review these KPIs?
It depends on the metric and the organization’s operating goals. Monthly reporting by itself can slow response time when systemic issues start to build, which is why real-time dashboards often play an important role in tracking metrics such as days in accounts receivable, denial rates, and net collection rates.
For payment posting accuracy, weekly audits of a small claim sample can help catch variances early, before they turn into a larger billing problem. Monthly reviews of denial categories can also help revenue cycle leaders spot recurring high-dollar trends and address the root cause.
What usually causes low auto-post rates in behavioral health?
Low auto-post rates in behavioral health often point to a workflow problem, not just a billing problem. In many organizations, payment posting still depends on manual steps, disconnected systems, and data that is not consistent from one stage of the revenue cycle to the next.
Common causes include non-standardized ERA formats, missing authorization details, and payer-specific adjustment rules that are difficult to apply automatically. When posting logic cannot read or trust the incoming data, claims and payments are pushed into exception queues for staff review.
Front-end mistakes also play a major role. Eligibility gaps, incomplete intake data, or incorrect benefits verification can create downstream posting issues that block automation. Matching problems tied to bundled services, telehealth modifiers, or coordination of benefits can reduce auto-post performance even further.



- Behavioral Health
- EHR Systems
- Addiction Treatment EHR
- mental health
- Telehealth
- addiction treatment
- Behavioral health facility
- Substance Abuse Disorder
- behavioral Health center
- HIPPA Compliant
- ehrsoftware
- PTSD
- behavioral health ehr
- Depression
- hipaa
- Anxiety
- MentalHealthMatters
- RCM
- claim denials
- clinical documentation
- mental health awareness
- screening tools

September 15, 2026

September 15, 2026

September 14, 2026

September 11, 2026

September 10, 2026

September 09, 2026
Recommended Posts

Thursday, July 23, 2026
How Predictive Analytics Reduces Claim Denials
How Predictive Analytics Reduces Claim Denials Claim denials often start with small billing mistakes, and predictive ...

Saturday, August 15, 2026
Predictive Analytics for Revenue Cycle in SUD Care
Behavioral health claims are denied at roughly 12% to 20%, and some SUD programs see denial rates as high as 20% to 28%.

Monday, August 17, 2026
Behavioral Health Billing Workflow Mapping 2026
Most behavioral health billing problems start before the claim is sent.