

Behavioral health claims are denied at roughly 12% to 20%, and some SUD programs see denial rates as high as 20% to 28%.
For treatment centers, predictive analytics can help flag claims likely to be denied, delayed, or filed late before cash is lost.
For revenue cycle leaders, the core value is simple: use claim, authorization, and clinical data to spot risk earlier and route work to the right team. That can help centers reduce preventable denials, watch timely filing deadlines, estimate 30/60/90-day cash flow, and focus staff time on accounts with the biggest dollar impact.
What matters most:
- Pre-bill denial scoring to catch documentation, coding, coverage, and authorization issues
- Late-claim alerts tied to unsigned notes, encounter-to-claim lag, and payer filing limits
- Payer delay forecasts to spot cash pressure before it hits A/R and the bank account
- Account ranking based on denial risk, expected reimbursement, and filing deadline pressure
- Connected data across clinical records, authorizations, and claims
- Human review rules for retro-auth changes, COB issues, policy shifts, and new service lines
For SUD organizations, predictive analytics is less about software hype and more about earlier visibility. When scores are placed inside daily billing workflows and tied to clear follow-up steps, they can help protect revenue, lower write-off risk, and give leaders a clearer view of near-term cash.
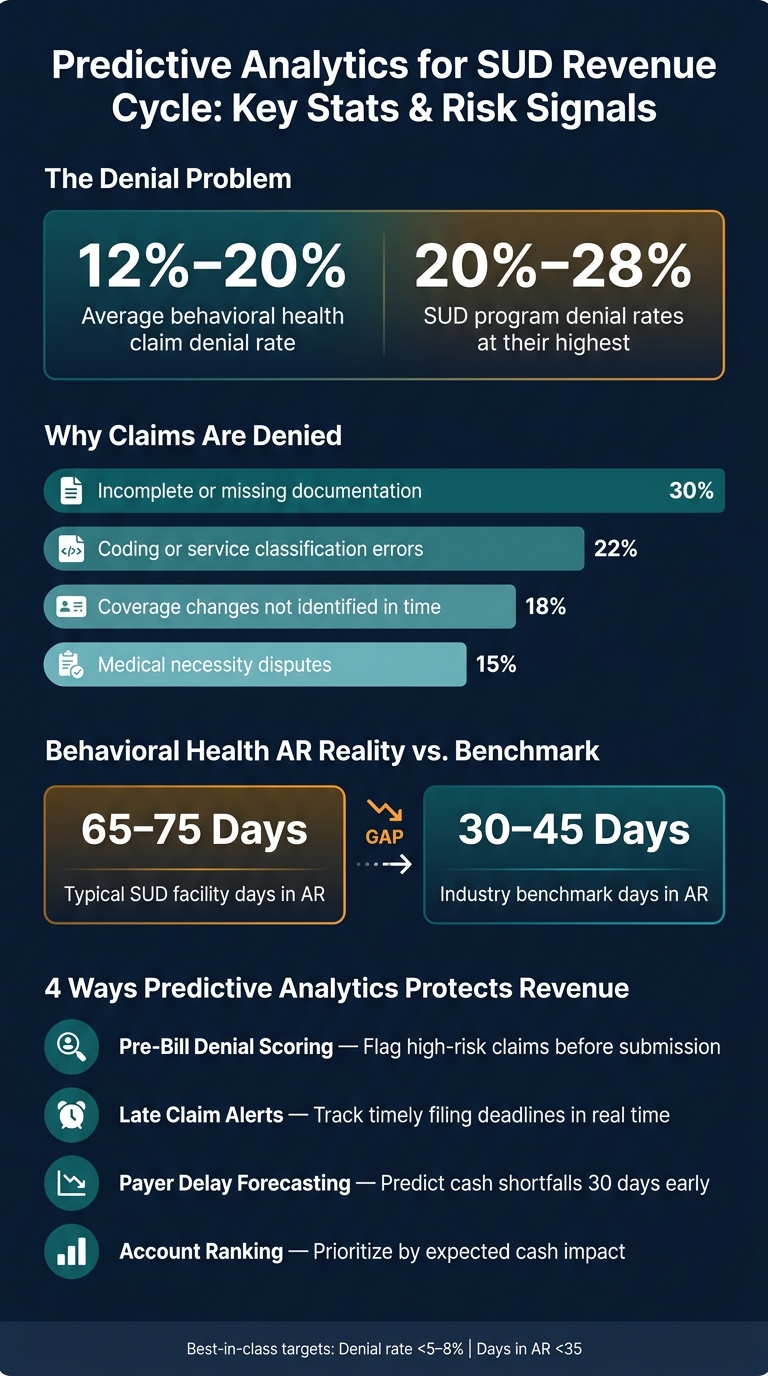
Predictive Analytics for SUD Revenue Cycle: Key Stats & Risk Signals
The 4 Predictive Analytics Use Cases Billing Teams Need Most
Predictive analytics helps billing teams turn past claim behavior into practical risk signals.
In SUD revenue cycle operations, that usually means spotting denial risk before submission, identifying claims that may miss timely filing limits, forecasting payer-driven cash delays, and ranking accounts by likely cash impact.
Each use case addresses a different source of revenue loss. Used together, they give billing leaders a clear operating framework for tighter claim control and better cash visibility.
Predicting Denial Risk Before Claim Submission
Most denials are not driven by clinical disputes alone.
A recent synthesis found that 30% of denials were tied to incomplete or missing documentation, 22% to coding or service classification errors, 18% to coverage changes the provider did not identify in time, and only 15% to medical necessity disputes.[10]
For billing leaders, that shifts the focus upstream. The issue is often not whether a claim was billed, but whether it was ready to be billed.
Denial risk models review claim-level data at the point of claim creation. That includes ICD-10 diagnosis codes, CPT/HCPCS service codes, modifier combinations, place of service, and level of care such as residential, PHP, or IOP.
They also review documentation status, including missing clinician signatures, unsigned or late progress notes, absent treatment plans, inconsistent time entries, and missing ASAM criteria. On the payer side, the model can factor in prior authorization rules, billed units compared with authorized units, payer history, and eligibility or coordination-of-benefits issues found in past claims.
Claims that fall below a set risk threshold can move forward to submission. Higher-risk claims can be routed into a pre-bill review queue, then sorted by issue type so the right staff member can fix the problem before the claim goes out. That matters in behavioral health, where delays often start with small breakdowns between clinical documentation, utilization review, and billing.
|
Predictive Data Point |
Risk Flagged |
Denial Risk Level |
|---|---|---|
|
Missing functional impairment or risk scores in clinical notes |
Medical necessity gap |
High |
|
Authorization units mismatch or expired authorization |
Administrative mismatch |
High |
|
CPT/HCPCS code billed without the required modifier |
Technical coding error |
Medium |
|
High historical denial rate for a specific ICD-10 and payer combination |
Payer-specific pattern |
High |
|
Eligibility or coordination-of-benefits issue in prior claims |
Coverage problem |
Medium |
Claims that clear pre-bill review still need close filing control and payer follow-up.
Identifying Late Claim Risk and Timely Filing Exposure
Timely filing denials can be especially costly because they often end in write-offs. Benchmark data places CO-29 denials at about 3.9% of all denials.[8]
In SUD billing, late claims usually trace back to encounter-to-claim lag, unsigned notes, unfinished treatment plans, pending authorizations, and payer filing rules that vary by contract.
Predictive models can track the signals that lead to late filing exposure, including days since service, note signature status, treatment plan completion, remaining days before the filing deadline, and workflow events such as note routed, claim created, claim held, or documentation requested. This gives billing teams a chance to intervene before the filing window closes.
A useful alert does more than assign a risk score. It also tells the team what is wrong and how much time is left.
High late-filing risk: 72 days since service, note unsigned, 18 days remaining to payer deadline.[2]
In a connected workflow, these alerts can go to both billing and clinical staff at the same time. Opus Behavioral Health EHR can send that alert to the clinician who needs to finish the note and to the billing team tracking the payer deadline. That kind of shared visibility can help reduce the back-and-forth that often slows claims in treatment settings.
Once filing risk is under control, the next issue is payment timing.
Forecasting Payer Delay Patterns and Cash Shortfalls
Behavioral health facilities often carry 65 to 75 days in AR, well above the 30 to 45 day benchmark.[6][7][9] That gap often reflects payer behavior that is frustratingly slow, but also predictable enough to model over time.
Payer delay models look at average days to pay clean claims, denial rates by service type, partial payment frequency, underpayments, and appeal cycle times. They can also use AR aging by payer and service line, current census, and expected charges by level of care to estimate 30-, 60-, and 90-day cash inflow.[2][3] For finance and operations leaders, that turns AR from a backward-looking report into a forward-looking planning tool.
|
Payer Metric |
Predicted Delay Signal |
Impact on Cash Forecast |
|---|---|---|
|
Average days to pay |
Increasing trend over 3 months |
Delayed 30-day cash availability |
|
Denial rate by service type |
Frequent medical necessity denials |
Increased 60–90 day AR aging; higher appeal labor cost |
|
Partial payment rate |
Frequent underpayments |
90-day shortfall between expected and actual collections |
|
Appeal success rate |
Low recovery on specific modifiers |
Increased write-offs in long-term forecasts |
|
Authorization renewal lead time |
Renewals starting less than 7 days before end date |
Immediate cash gap due to unauthorized sessions |
If a payer’s average days to pay is climbing while denial rates also get worse, finance leaders may be able to see a cash shortfall 30 days before it hits the bank account.[2][3] That early signal can support staffing decisions, spending controls, and payer escalation before payroll or other operating costs come under pressure.
Ranking Accounts by Expected Cash Impact
Once risk is identified, billing teams still need to decide where to act first. That is where account scoring becomes useful. An account score can combine denial probability, expected allowed amount, days left before the filing deadline, payer collectibility based on past payment behavior, and expected appeal success for claims that have already been denied.[1][4]
The output is a ranked worklist tied to expected cash impact. Supervisors can then assign work based on staff role and skill. For example:
- Authorization staff can focus on coverage and unit issues.
- Coders can work diagnosis-procedure conflicts.
- AR follow-up staff can target payers with known delay patterns.
This kind of ranking helps keep effort focused on the claims most likely to affect near-term cash, instead of spreading staff time evenly across the entire aging report.
How Clinical Records, Authorizations, and Claims Connect to Revenue Outcomes
In SUD billing, predictive accuracy depends on how well clinical notes, authorization history, and claim outcomes connect. When those data sets sit in separate systems, risk scores often miss the actual reason a claim may fail. When they are tied together, billing teams can trace denial risk to a missing field, an expired authorization, or a documentation gap before the claim is submitted. Those signals come from three connected data sets.
The Data Sources That Matter Most
These inputs come from three connected sources: clinical records, authorization data, and billing and claims data.
|
Data Domain |
Key Fields |
Primary Predictive Use |
|---|---|---|
|
Clinical Records |
Diagnoses, ASAM criteria, progress notes, treatment plan status, lab results, no-show patterns |
Medical necessity denial risk, late claim risk |
|
Authorization Data |
Auth start/end dates, approved units, concurrent review notes, benefit limits |
Authorization mismatch denials, eligibility gaps, cash forecasting |
|
Billing & Claims |
CPT/HCPCS codes, CARC/RARC codes, payment posting, A/R aging, payer lag times |
Payer delay patterns, underpayment forecasting, cash shortfall forecasting |
A denial code such as no authorization on file only becomes useful when a model can trace it back to the source. That source may be a concurrent review that was never submitted or a treatment plan that was not updated before the authorization window closed.
Once the data are normalized, aligned by date, and linked by patient, episode, and payer, the root cause of a denial becomes much easier to see.
What Models Learn from Documentation and Authorization History
Over time, models learn which documentation and authorization patterns tend to come before denials. A residential episode with an outdated treatment plan, an authorization expiring in three days, and no concurrent review presents high denial risk.
ASAM documentation gaps are reported as the leading cause of level-of-care denials for residential SUD claims.[5] When a model sees residential billing tied to a mild SUD diagnosis and no documented history of failed lower levels of care, it flags that mix as high risk for a clinical review denial.
The same logic applies to attendance and note timing. If attendance records or progress notes show fewer sessions than authorized, or if note dates fall outside the authorization period, models treat that mismatch as a strong sign of an administrative denial.
Opus Behavioral Health EHR links clinical documentation, authorization tracking, and billing in one workflow, which gives models cleaner episode-level data. That can reduce manual data pulls and help teams spot note timeliness issues and coverage gaps sooner. This type of connected data foundation is what makes risk scores usable inside day-to-day billing workflows.
How to Implement Predictive Analytics in an SUD Billing Workflow
Data Readiness, Governance, and Model Inputs
Predictive analytics in an SUD billing workflow starts with one basic truth: bad data leads to bad forecasts. If source data is incomplete, inconsistent, or hard to classify, denial, filing, delay, and cash predictions will be unreliable.
The first step is a data audit across the EHR, RCM platform, and clearinghouse. The goal is to find missing fields, mismatched codes, and authorization details buried in free-text records. For most SUD billing teams, the highest-impact model inputs include payer IDs, authorization status, requested and approved units, authorization start and end dates, service dates, claim submission dates, and denial reason codes mapped into standard buckets such as timely filing, medical necessity, coverage, or coding.
Data quality alone is not enough. Governance needs the same level of attention. SUD billing data often includes PHI protected under HIPAA and 42 CFR Part 2, so access controls cannot be loose or informal.
Teams typically need:
- Role-based access
- Encryption
- Audit logs
- BAAs
A cross-functional review group should also be in place before models move into production. In many behavioral health organizations, that group includes the billing director, compliance officer, clinical leadership, and an IT or analytics lead.
Their role is to approve which inputs the model can use, review how outputs are presented, and make sure the process fits both financial and compliance requirements.
That structure matters because predictive analytics should be treated as a governed clinical-financial workflow, not as a side project owned only by IT.
Embedding Risk Scores into Daily Work Queues and Dashboards
Once the data is clean and governance is in place, the next step is to place risk scores directly inside day-to-day billing work. If staff have to leave their normal screens to find the scores, usage often drops.
The most effective approach is to place scores in the queues teams already use, including pre-bill worklists, authorization follow-up lists, and aging dashboards. High-risk claims should move to the top of pre-bill queues, with the reason for the flag shown in plain language. Staff should not have to interpret raw probability scores during a busy workday.
Simple visual labels can make this easier. Red, yellow, and green indicators give billing teams a fast read on risk level, and each level should tie to one defined action. In practice, that means denial risk belongs in pre-bill queues, late-claim risk belongs in authorization follow-up lists, and payer delay or projected cash gaps belong in aging and cash dashboards.
Opus Behavioral Health EHR can surface denial risk, payer lag, and cash flow on role-based dashboards, keeping clinical documentation, authorization tracking, and billing in one environment. Those same dashboards should feed the KPIs reviewed after go-live.
Measuring Impact After Go-Live
Once scores are live in the workflow, leadership needs to test whether they are changing billing performance in a measurable way. That means reviewing a fixed set of KPIs on a set cadence and linking each metric to a clear operational response.
|
KPI |
Review Frequency |
Operational Change Triggered |
|---|---|---|
|
Denial rate |
Weekly, Monthly |
Revise documentation/coding SOPs; adjust training; target high-risk payers or service lines |
|
Late claim volume |
Weekly |
Identify providers or departments causing delays; add pre-bill checks; adjust submission workflows |
|
Average reimbursement lag |
Monthly |
Intensify payer follow-up; refine lag prediction models; reassess payer mix strategy |
|
Days in A/R |
Monthly |
Adjust follow-up priorities; escalate chronic slow payers; revisit contract terms or internal workflows |
|
Appeal success rate |
Monthly, Quarterly |
Improve appeal templates; enhance clinical documentation training; focus appeals on claims with highest predicted recovery |
|
Forecast accuracy |
Monthly |
Update model training data; refine features; revise cash planning assumptions |
These measures help executive teams connect model output to action. A denial spike may point to weak documentation patterns or coding drift. A rise in late claim volume may show that specific providers, departments, or handoff points are slowing submission. Weak forecast accuracy can signal stale training data or feature gaps rather than a staffing issue.
A denial rate below 5–8% and days in A/R under 35 are widely cited as best-in-class targets in U.S. healthcare.[11][12][13][14] If predicted cash routinely misses actual cash by more than ±10%, the model should be retrained.
In many behavioral health organizations, these KPIs are most useful when they become a standing item in monthly revenue cycle meetings, so predictive analytics stays tied to day-to-day operating decisions rather than sitting in a dashboard no one uses.
Limits, Data Gaps, and Adoption Risks to Know
Even well-built models need guardrails. Predictive analytics tends to perform best when claim patterns are stable and repeatable. It becomes less reliable when data is incomplete, payer rules change, or a service line does not yet have enough billing history. For behavioral health organizations, those weak points are usually predictable, which means they can also be managed with the right review process.
Where Models Fail and Need Human Review
Some claim scenarios still require direct staff review.
Retroactive authorization changes are one of the biggest trouble spots. When a state Medicaid agency or managed care organization later changes authorization spans, approved units, or level-of-care decisions, a claim that once looked low risk may no longer be safe to resubmit.
In those cases, denial scoring can understate the risk because the model was working from the original authorization record. These claims should be reviewed against the updated authorization and clinical note record before resubmission.
Coordination of benefits (COB) issues create a similar gap. COB denials often depend on the order of primary and secondary coverage, employer group updates, or overlapping coverage periods that may not appear clearly in claim-level data. A model may detect that a payer often denies for COB, but that does not resolve the claim. A biller still needs to investigate the coverage details and, when needed, confirm them with the payer or patient. That extra work can slow clean resubmission and extend A/R aging.
Shifting state and payer policies are another weak area. Historical denial patterns lose value when payer rules move faster than the model is updated.
Starting January 1, 2026, certain payers must respond to standard prior authorization requests within 7 calendar days and expedited requests within 72 hours and provide specific denial reasons.[15] Claims with service dates in the first 90 days after a known policy change should be routed for human review. Policy-change dates should also be logged so teams know where historical data stops being dependable.
Small claim volumes for niche contracts or new programs can also distort risk scoring. A virtual IOP launch or a new MAT clinic may have only a short billing history. In that setting, a model can latch onto a small number of early outcomes and either overstate risk or miss a pattern entirely. New programs usually need rule-based review until enough claim volume exists to support stable scoring.
How to Build Model Trust Over Time
Trust builds when risk flags are clear and usable. Each flag should explain the main reason in plain language. For example, a claim might show high denial risk because the authorization end date has passed and the clinical note remains unsigned. That kind of explanation helps billers understand why the claim was flagged and what needs to be fixed. It also cuts down on wasted effort in pre-bill and A/R queues because staff are not left guessing what a score means. In practice, workflow rules in Opus Behavioral Health EHR can route new denial/edit code claims, retro-auth claims, and COB claims into a manual review path.
Too many high-risk alerts can wear teams down. That is why model oversight cannot stop at the claim level. Teams should run routine back-testing by comparing predicted outcomes with actual results and then reviewing the misses. Denial reviews and direct biller feedback can help spot drift before it starts affecting cash flow or denial performance. If predicted cash is regularly off from actual cash by more than ±10%, or if denial rate predictions start separating from actual payer or service-line outcomes, the model likely needs retraining.
Trust also improves when staff can connect each score to a next step. The table below outlines common failure points and the operational response that can help contain them.
|
Failure Point |
Why It Fails |
Fix |
|---|---|---|
|
Retroactive auth changes |
Model trained on original auth data; retroactive edits not captured in real time |
Auto-route claims with auth amendments to manual review queue |
|
COB denials |
Primary/secondary payer order not visible in claim data |
Flag payer COB history; require biller investigation before resubmission |
|
Policy changes (telehealth, MAT, parity) |
Historical patterns no longer match new rules |
Record policy-change dates; treat affected claims as low-confidence |
|
Small volume / new programs |
Too few records for stable pattern recognition |
Use rule-based flags; set minimum claim volume thresholds before deploying scores |
|
Inconsistent denial coding |
Generic codes prevent root-cause learning |
Standardize CARC/RARC mapping; audit coding quarterly |
|
Staff distrust / alert fatigue |
Scores lack explanation or actionable next steps |
Show main drivers; calibrate thresholds to reduce noise |
Model trust usually develops in stages. Behavioral health operators often get better adoption when billers are involved early, when new scoring logic starts with a pilot group, and when scores are framed as a way to sort work rather than judge staff performance.
With those exceptions defined, the next decision is how predictive signals should fit into day-to-day billing workflows.
Conclusion: Using Predictive Signals to Protect Revenue in SUD Care
Standard revenue cycle reports show what has already broken down. Predictive analytics shows what may break down next: before a claim goes out, before a filing window closes, and before payer lag starts to slow cash flow.
For SUD treatment centers, that timing matters. Reimbursement often depends on complex authorizations, changing lengths of stay, and payer-specific denial trends. Earlier visibility can help teams prevent avoidable revenue loss instead of chasing it after the fact.
Predictive models only work when clinical, authorization, and claims data are connected, standardized, and complete. Without that base, denial forecasts, payment delay alerts, and cash projections are far less dependable. Platforms like Opus Behavioral Health EHR, which bring EHR, RCM, and reporting together in one system, can help support the structured records and data consistency these models rely on.
Once a model is in place, execution becomes the main issue. A score by itself does not protect revenue. Teams need workflows that turn a signal into action. High-risk claims can move into review before submission. Cash-risk forecasts can help finance leaders adjust reserves or speed up follow-up with payers. That link between prediction and team action is what makes predictive analytics useful in day-to-day revenue operations.
This kind of operating discipline reaches beyond collections. More stable cash flow can help treatment centers support staffing levels, maintain program continuity, and protect patient access. In SUD care, predictive analytics works best when it is tied to clean data and built into daily workflows rather than treated as a reporting add-on.
FAQs
How does predictive analytics reduce claim denials in SUD billing?
Predictive analytics can reduce claim denials in SUD billing by flagging high-risk claims before they go out the door. That includes common issues such as coding mismatches, missing functional impairment details, and incomplete risk assessments.
By using historical claim data alongside real-time clinical documentation, Opus Behavioral Health EHR identifies errors and documentation gaps early in the workflow. This gives billing teams time to correct issues, align records with payer requirements, cut down on rework, and lower the risk of avoidable denials.
What data is needed to predict late claims and cash delays?
Predicting late claims and cash delays starts with one connected, clean data set that ties clinical work to financial results.
That means pulling together patient demographics, insurance eligibility, billing data such as ICD, CPT, and HCPCS codes, and complete clinical documentation. Clinical records should include session notes, treatment plans, and measures such as PHQ-9 or GAD-7. When those data points sit in one system and align across workflows, organizations can spot the issues that often slow reimbursement.
Systems such as Opus Behavioral Health EHR can help flag:
- Missing authorizations
- Coding mismatches
- Documentation gaps tied to denials
- Revenue delays linked to incomplete records
For behavioral health operators, this connection matters. A claim rarely goes late because of a single billing error alone. More often, the delay starts upstream with missing clinical detail, an eligibility issue, or a mismatch between services delivered and what was documented.
When should staff override a predictive risk score?
Staff should override a predictive risk score only when documented, case-specific evidence shows that the model inputs are incorrect or no longer align with the current authorization, clinical documentation, or claim details.
In most cases, the score should serve as a prompt for review before submission, not an automatic reason to change course. Predictive analytics can help teams spot issues early, but human judgment still matters when handling exceptions and making compliance-related decisions.



- Behavioral Health
- EHR Systems
- Addiction Treatment EHR
- mental health
- Telehealth
- addiction treatment
- Behavioral health facility
- Substance Abuse Disorder
- behavioral Health center
- HIPPA Compliant
- ehrsoftware
- PTSD
- behavioral health ehr
- Depression
- hipaa
- Anxiety
- MentalHealthMatters
- RCM
- claim denials
- clinical documentation
- mental health awareness
- screening tools

September 15, 2026

September 15, 2026

September 14, 2026

September 11, 2026

September 10, 2026

September 09, 2026
Recommended Posts

Thursday, August 27, 2026
How Predictive Analytics Guides SUD Care Plans
Predictive analytics helps SUD providers act before relapse, dropout, overdose, or readmission.

Thursday, July 23, 2026
How Predictive Analytics Reduces Claim Denials
How Predictive Analytics Reduces Claim Denials Claim denials often start with small billing mistakes, and predictive ...

Monday, July 20, 2026
Personalized EHR Intake Forms: Guide for SUD Clinics
One intake form for every SUD patient is a fast way to create delays, denials, and compliance gaps.